部署 Prometheus Server
安装简介:
- Prometheus 可以通过不同的方式安装部署prometheus监控环境,但是实际生产环境只需要根据实际需求选择其中一种方式部署即可,而且无论是使用哪一种方式安装部署的prometheus server,以后的使用都是一样的:
联网直接安装
使用apt或者yum安装
~# apt install prometheus
基于二进制文件安装
下载安装文件
因为生产环境大概率是Linux的,所以我们选择Linux下的发布包,把Prometheus 和 Alertmanager 两个包都下载下来。
注:Prometheus 的下载地址:https://prometheus.io/download
root@prometheus-server1:~# mkdir /apps
root@prometheus-server1:~# wget https://github.com/prometheus/prometheus/releases/download/v3.0.1/prometheus-3.0.1.linux-amd64.tar.gz
root@prometheus-server1:~# cd /apps/
root@prometheus-server1:~# tar xvf prometheus-3.0.1.linux-amd64.tar.gz
root@prometheus-server1:~# ln -sv /apps/prometheus-3.0.1.linux-amd64 /apps/prometheus
'/apps/prometheus' -> '/apps/prometheus-3.0.1.linux-amd64'
root@prometheus-server1:~# cd /apps/prometheus
root@prometheus-server1:~# ll
total 196072
drwxr-xr-x 2 3434 3434 38 Feb 12 04:58 console_libraries
drwxr-xr-x 2 3434 3434 173 Feb 12 04:58 consoles
-rw-r--r-- 1 3434 3434 11357 Feb 12 04:58 LICENSE
-rw-r--r-- 1 3434 3434 3773 Feb 12 04:58 NOTICE
-rwxr-xr-x 1 3434 3434 104427627 Feb 12 04:51 prometheus #prometheus服务可执行程序
-rw-r--r-- 1 3434 3434 934 Feb 12 04:58 prometheus.yml #prometheus配置文件
-rwxr-xr-x 1 3434 3434 96322328 Feb 12 04:54 promtool #测试工具,用于检测配置prometheus配置文件、检测metrics数据等
# ./promtool check config prometheus.yml
Checking prometheus.yml
SUCCESS: prometheus.yml is valid prometheus config file syntax
创建 service 启动文件
root@prometheus-server1:~# cat <<EOF >/etc/systemd/system/prometheus.service
[Unit]
Description=Prometheus Server
Documentation=https://prometheus.io/docs/introduction/overview/
After=network.target

[Service]
Type=simple

WorkingDirectory=/apps/prometheus/
ExecStart=/apps/prometheus/prometheus --config.file=/apps/prometheus/prometheus.yml --storage.tsdb.path=/apps/prometheus/data --web.enable-lifecycle --enable-feature=remote-write-receiver --query.lookback-delta=2m --web.enable-admin-api

Restart=on-failure
SuccessExitStatus=0
LimitNOFILE=65536
StandardOutput=syslog
StandardError=syslog
SyslogIdentifier=prometheus

[Install]
WantedBy=multi-user.target
EOF

root@prometheus-server1:~# systemctl daemon-reload && systemctl restart prometheus && systemctl enable prometheus.service
root@prometheus-server1:~# systemctl status prometheus
基于 docker
基于docker镜像直接启动或通过docker-compose编排
https://prometheus.io/docs/prometheus/latest/installation
# 官网
docker run \
  -p 9090:9090 \
  -v /path/to/prometheus.yml:/etc/prometheus/prometheus.yml \
  prom/prometheus
# 修改某些配置
docker run -d -p 9090:9090 -v /apps/prometheus/:/etc/prometheus/ quay.io/prometheus/prometheus --config.file=/etc/prometheus/prometheus.yml --web.enable-lifecycle

# 热更新配置
curl -X POST http://localhost:9090/-/reload
# 日志显示以下内容即表示配置文件热加载成功:
... msg="Loading configuration file" filename=prometheus.yml ...
基于operator部署在kubernetes环境部署
https://github.com/prometheus-operator/kube-prometheus
Prometheus 进程的启动参数
这里需要重点关注的是 Prometheus 进程的启动参数,我在每个参数下面都做出了解释,你可以看一下。
# 指定配置文件
--config.file=/apps/prometheus/prometheus.yml

# 指定 Prometheus 时序数据的硬盘存储路径
--storage.tsdb.path=/apps/prometheus/data

# 启用生命周期管理相关的 API,比如调用 /-/reload 接口就需要启用该项
--web.enable-lifecycle

# 启用 remote write 接收数据的接口,启用该项之后,categraf、grafana-agent 等 agent 就可以通过 /api/v1/write 接口推送数据给 Prometheus
--enable-feature=remote-write-receiver

# 即时查询在查询当前最新值的时候,只要发现这个参数指定的时间段内有数据,就取最新的那个点返回,这个时间段内没数据,就不返回了
--query.lookback-delta=2m

# 启用管理性 API,比如删除时间序列数据的 /api/v1/admin/tsdb/delete_series 接口
--web.enable-admin-api

# 指定监听地址
--web.listen-address="0.0.0.0:9090"

# 指定chunk大小,默认512MB
--storage.tsdb.retention.size=B, KB, MB, GB, TB, PB, EB

# 数据保存时长,默认15天
--storage.tsdb.retention.time=

# 最大查询超时时间
--query.timeout=2m

# 最大查询并发数
-query.max-concurrency=20

# 最大空闲超时时间
--web.read-timeout=5m

#最大并发连接数
--web.max-connections=512
如果正常启动,Prometheus 默认会在 9090 端口监听,访问这个端口就可以看到 Prometheus 的 Web 页面,输入下面的 PromQL 可以查到一些监控数据。
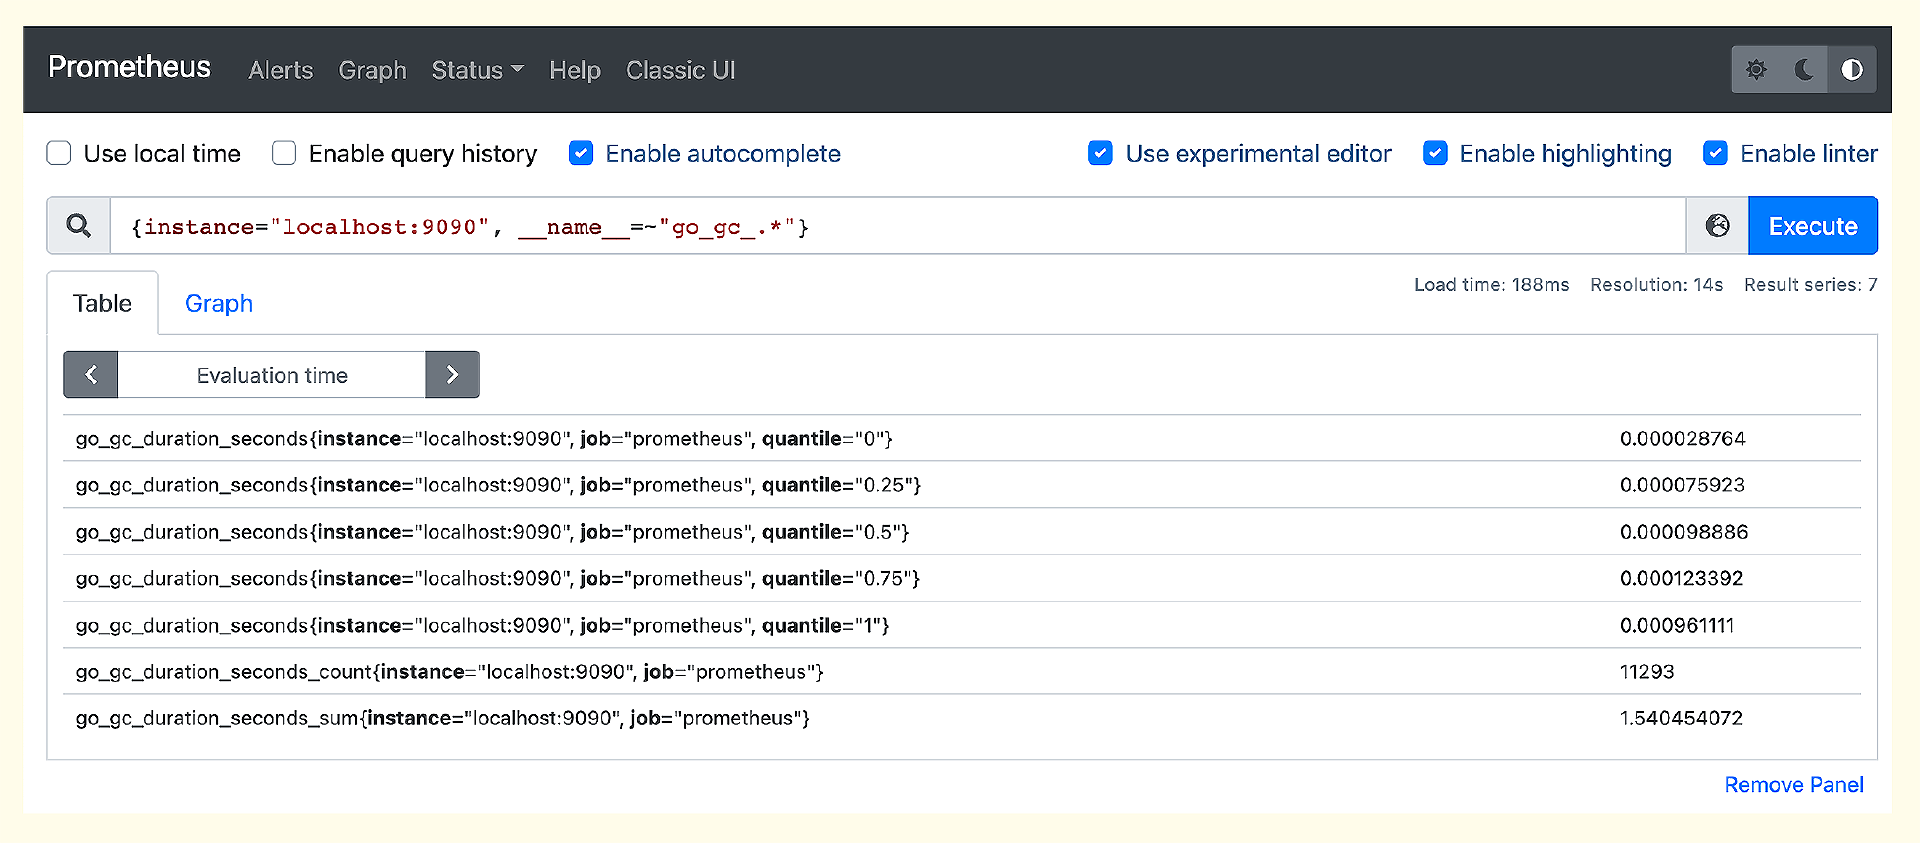
这个数据是从哪里来的呢?其实是 Prometheus 自己抓取自己的,Prometheus 会在 /metrics 接口暴露监控数据,你可以访问这个接口看一下输出。同时Prometheus在配置文件里配置了抓取规则,打开 prometheus.yml 就可以看到了。
scrape_configs:
  - job_name: 'prometheus'
    static_configs:
    - targets: ['localhost:9090']
localhost:9090是暴露监控数据的地址,没有指定接口路径,默认使用 /metrics,没有指定 scheme,默认使用 HTTP,所以实际请求的是 http://localhost:9090/metrics。
配置告警规则
Prometheus 进程内置了告警判断引擎,prometheus.yml 中可以指定告警规则配置文件,默认配置中有个例子。
rule_files:
  # - "first_rules.yml"
  # - "second_rules.yml"
我们可以把不同类型的告警规则拆分到不同的配置文件中,然后在 prometheus.yml 中引用。比如 Node-Exporter 相关的规则,我们命名为 node_exporter.yml,最终这个rule_files就变成了如下配置。
rule_files:
  - "node_exporter.yml"
我设计了一个例子,监控 Node-Exporter 挂掉以及内存使用率超过1%这两种情况。这里我故意设置了一个很小的阈值,确保能够触发告警。
groups:
- name: node_exporter
  rules:
  - alert: HostDown
    expr: up{job="node_exporter"} == 0
    for: 1m
    labels:
      severity: critical
    annotations:
      summary: Host down {{ $labels.instance }}
  - alert: MemUtil
    expr: 100 - node_memory_MemAvailable_bytes / node_memory_MemTotal_bytes * 100 > 1
    for: 1m
    labels:
      severity: warn
    annotations:
      summary: Mem usage larger than 1%, instance:{{ $labels.instance }}
最后,给 Prometheus 进程发个 HUP 信号,让它重新加载配置文件。
kill -HUP `pidof prometheus`
之后,我们就可以去 Prometheus 的 Web 上(Alerts菜单)查看告警规则的判定结果了。
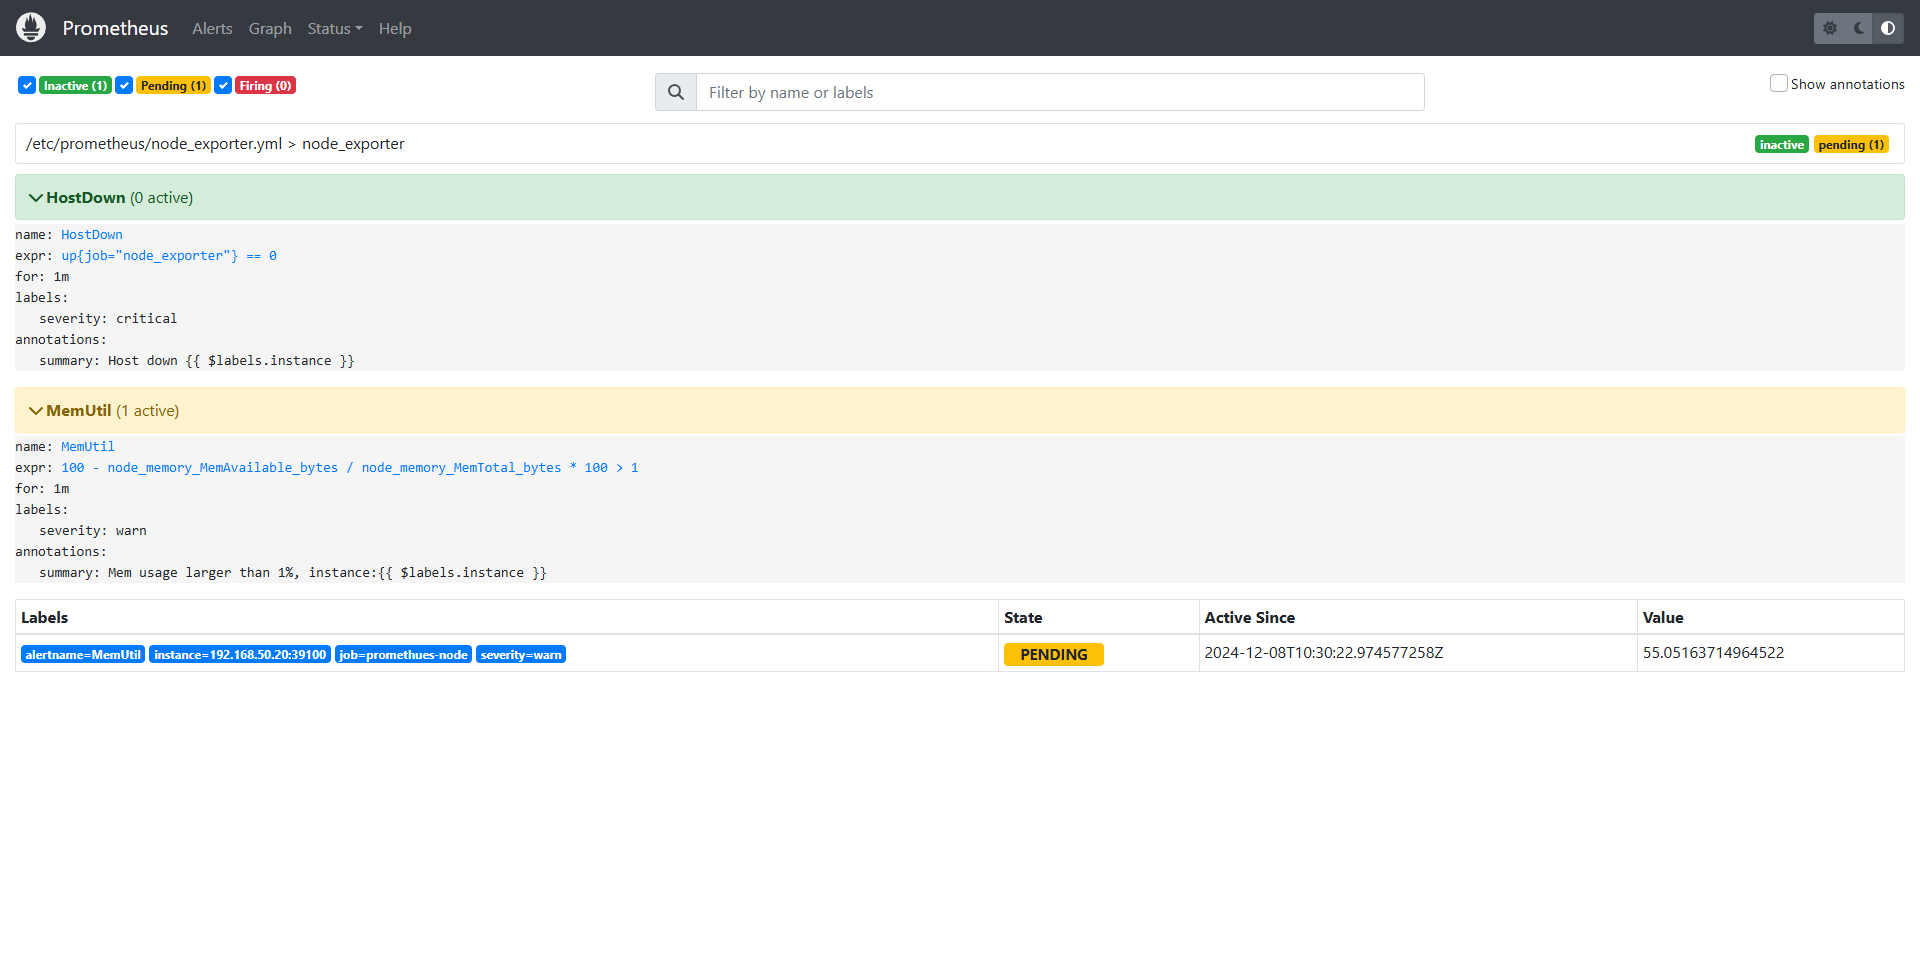
我们从图中可以看出,告警分成3个状态,Inactive、Pending、Firing。HostDown这个规则当前是Inactive状态,表示没有触发相关的告警事件,MemUtil这个规则触发了一个事件,处于Firing状态。那什么是Pending状态呢?触发过阈值但是还没有满足持续时长( for 关键字后面指定的时间段)的要求,就是Pending状态。比如 for 1m,就表示触发阈值的时间持续1分钟才算满足条件,如果规则判定执行频率是10秒,就相当于连续6次都触发阈值才可以。